priority_map() reads a rank map raster from a specified folder and creates
a ggplot2 map. It can plot the raster as continuous values or classify it
into discrete categories with custom breaks and labels.
Usage
priority_map(
  dir,
  output_folder_name = "output",
  breaks = NULL,
  labels = NULL,
  palette = "viridis",
  classify = FALSE,
  show_legend = TRUE,
  save_path = NULL,
  dpi = 300,
  width = 8,
  height = 6
)
Arguments
- dir
Character. Path to the variant folder containing the
outputfolder.- output_folder_name
Character. Name of the output folder inside
dir. Default is "output".- breaks
Numeric vector. Break points for reclassifying rank values. Required only if
classify = TRUE. Must have length equal tolength(labels) + 1.- labels
Character vector. Category labels for each reclassification interval. Required only if
classify = TRUE. Length must equallength(breaks) - 1.- palette
Character or vector of colors. If
"viridis", the function uses a reversed viridis palette (option"H") for classified maps. Otherwise, a vector of colors can be provided. Default is"viridis".- classify
Logical. If
TRUE, raster values are converted into classes usingbreaksandlabels. Default isFALSE.- show_legend
Logical. Whether to display the legend. Default is
TRUE.- save_path
Character. File path to save the plot. If
NULL(default), the plot is not saved.- dpi
Numeric. Resolution (dots per inch) for saved figures. Default is 300.
- width
Numeric. Width of the saved figure in inches. Default is 8.
- height
Numeric. Height of the saved figure in inches. Default is 6.
See also
Other postprocessing:
cost_summary(),
coverage_distribution(),
feature_curves(),
feature_representation(),
rank_similarity(),
summary_curves()
Examples
# \donttest{
withr::with_tempdir({
data_path <- system.file(
"extdata",
package = "ZonationR"
)
dir.create("output")
# copy example rankmap
file.copy(
file.path(data_path, "rankmap.tif"),
"output/rankmap.tif",
overwrite = TRUE
)
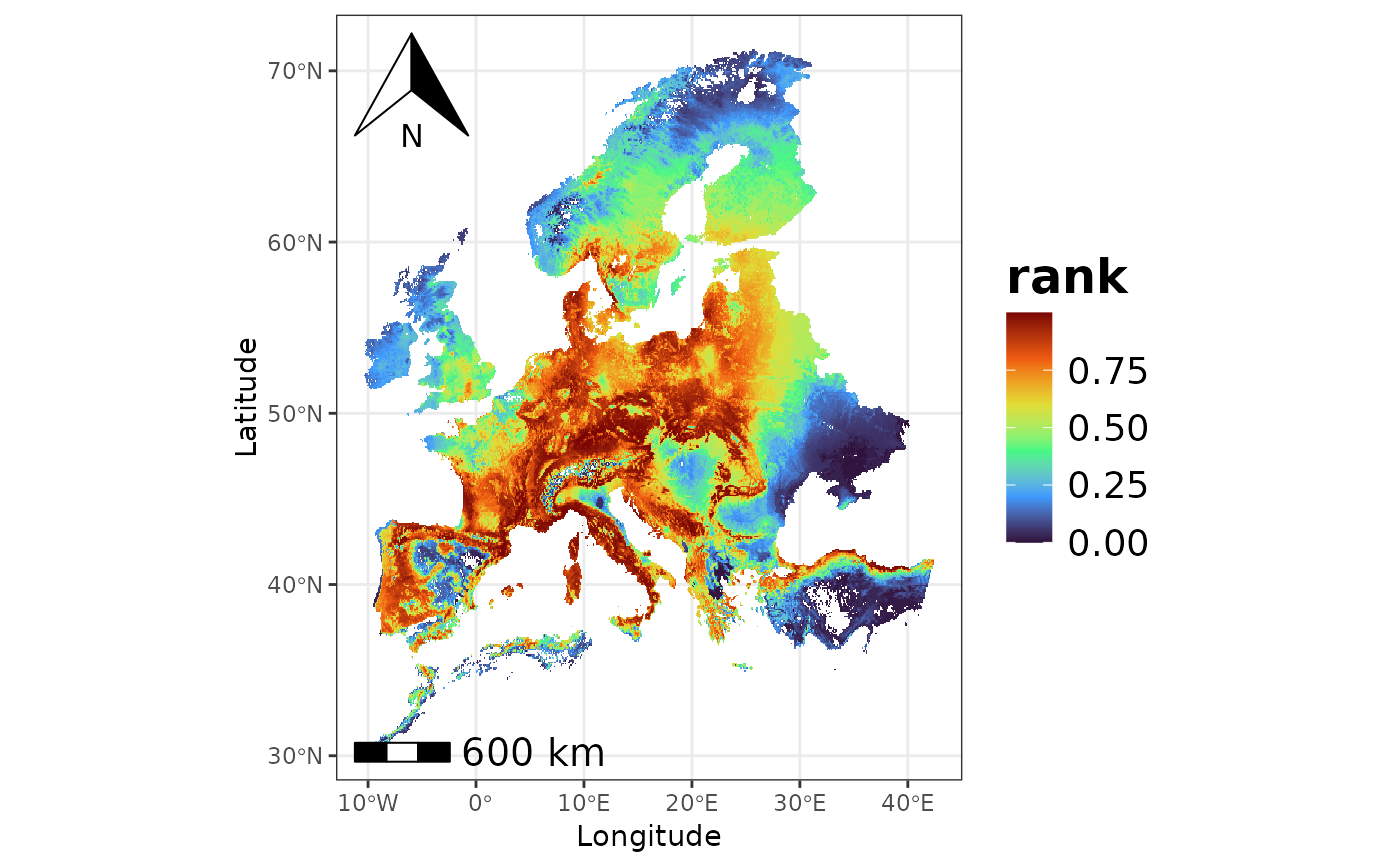
# ---- continuous map ----
p1 <- priority_map(
dir = ".",
output_folder_name = "output",
classify = FALSE
)
print(p1)
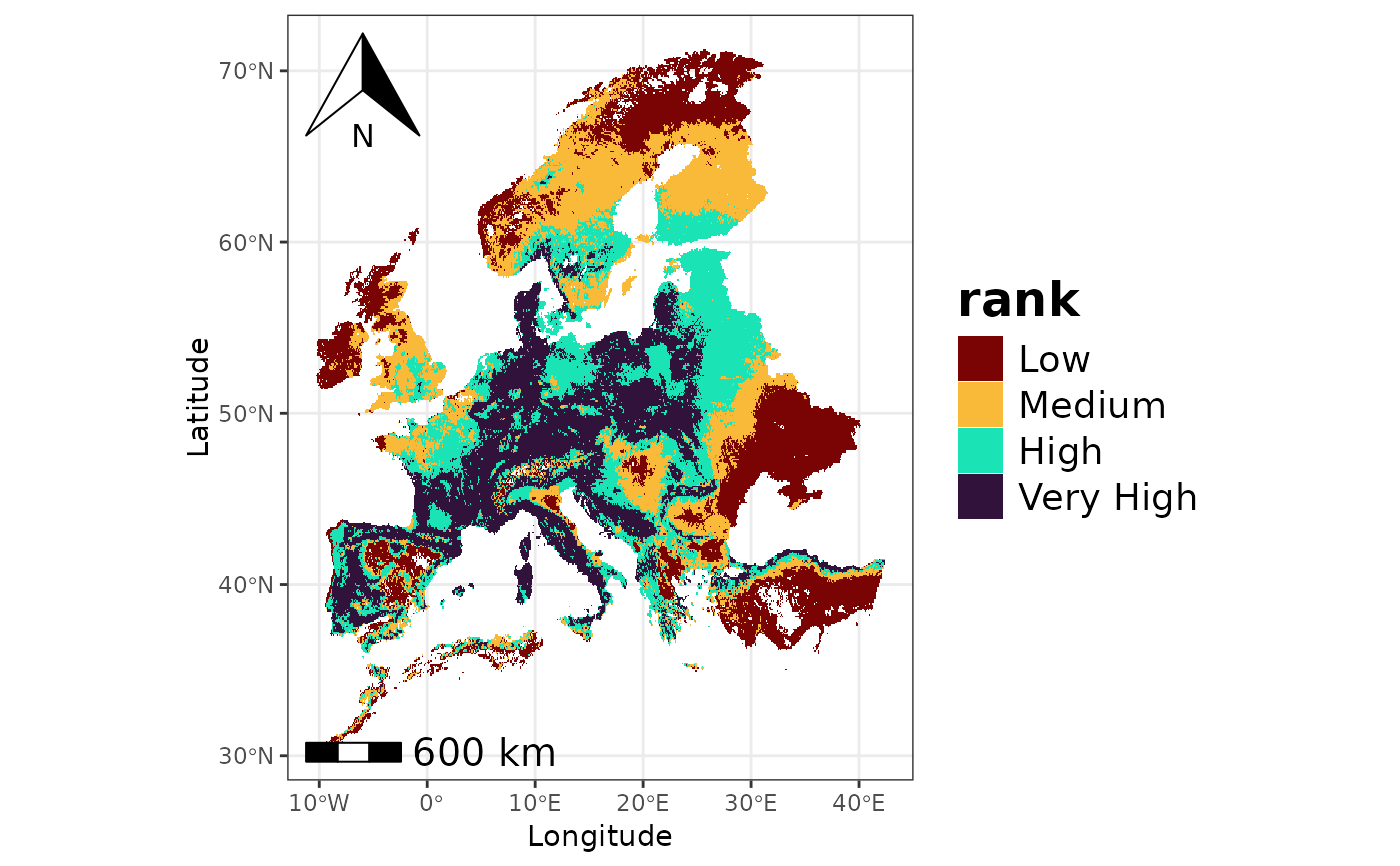
# ---- classified map ----
breaks <- c(0, 0.25, 0.5, 0.75, 1)
labels <- c("Low", "Medium", "High", "Very High")
p2 <- priority_map(
dir = ".",
output_folder_name = "output",
classify = TRUE,
breaks = breaks,
labels = labels
)
print(p2)
})
#> Scale on map varies by more than 10%, scale bar may be inaccurate
 #> Scale on map varies by more than 10%, scale bar may be inaccurate
 # }
# }