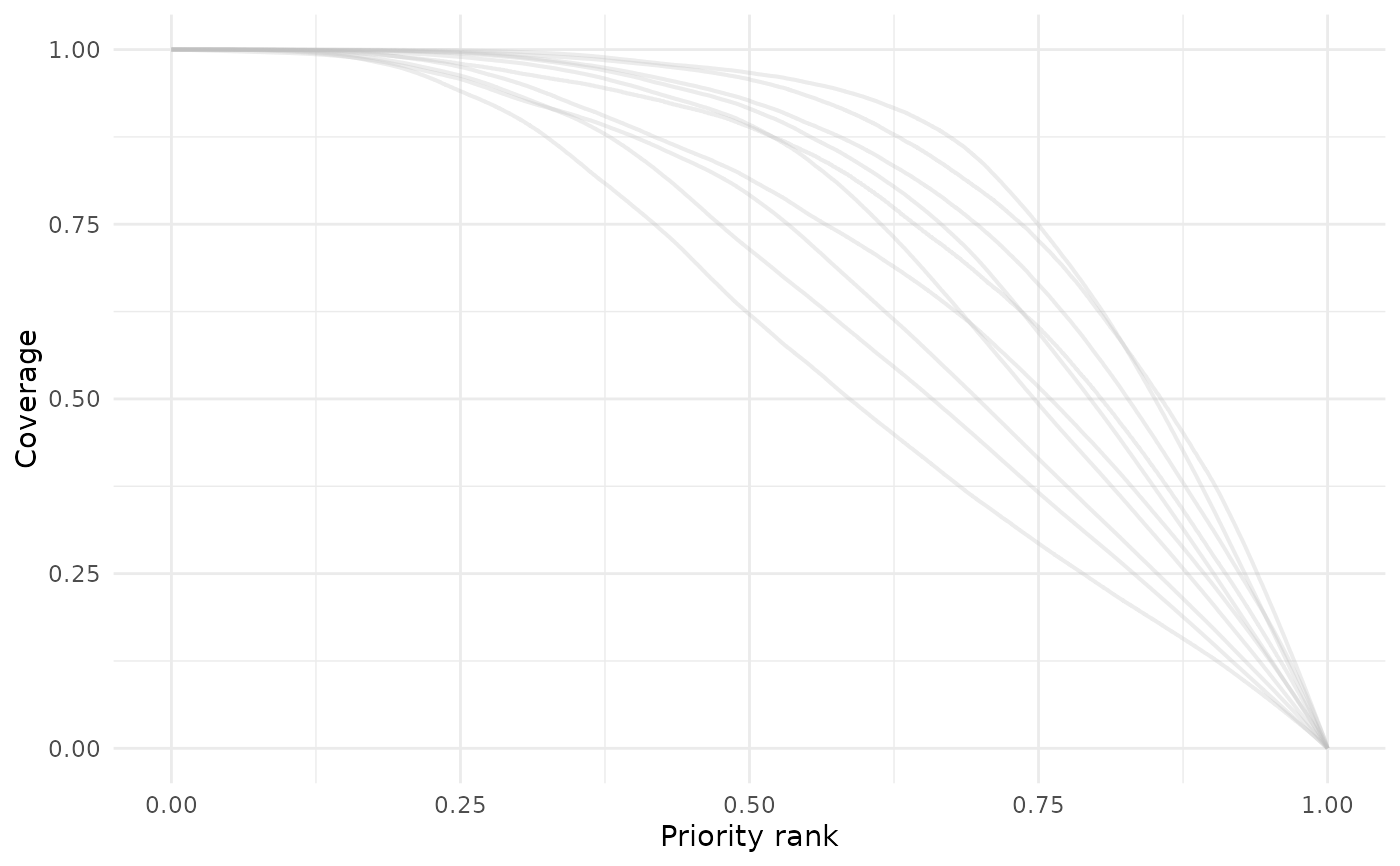
Reads the Zonation feature_curves.csv and features_info.csv
files, standardizes the feature names, and plots representation vs priority
rank for each feature. Supports a single color with transparency or the
viridis palette.
Usage
feature_curves(
  dir,
  output_folder_name = "output",
  palette = "gray",
  alpha = 0.3,
  show_legend = FALSE,
  save_path = NULL,
  dpi = 300,
  width = 8,
  height = 6
)
Arguments
- dir
Character. Path to the directory containing the Zonation output folder.
- output_folder_name
Character. Name of the Zonation output folder (default: "output").
- palette
Character. Either "gray" (default) for a single-color plot, a single color name, or "viridis" to use the viridis palette for multiple features.
- alpha
Numeric. Transparency of lines (0 fully transparent, 1 fully opaque). Default is 0.3.
- show_legend
Logical. If TRUE, shows legend (only applicable when palette = "viridis"). Default is FALSE.
- save_path
Character. Optional path to save the plot as PNG. Default is NULL (does not save).
- dpi
Numeric. Resolution (dots per inch) for saved figures. Default is 300.
- width
Numeric. Width of the saved figure in inches. Default is 12.
- height
Numeric. Height of the saved figure in inches. Default is 8.
Value
A ggplot object representing feature curves. If
save_path is provided, also saves the plot as PNG.
See also
Other postprocessing:
cost_summary(),
coverage_distribution(),
feature_representation(),
priority_map(),
rank_similarity(),
summary_curves()
Examples
# \donttest{
withr::with_tempdir({

  data_path <- system.file(
    "extdata",
    package = "ZonationR"
  )

  dir.create("output")

  file.copy(
    file.path(data_path, "feature_curves.csv"),
    "output/feature_curves.csv",
    overwrite = TRUE
  )

  file.copy(
    file.path(data_path, "features_info.csv"),
    "output/features_info.csv",
    overwrite = TRUE
  )

  p1 <- feature_curves(
    dir = ".",
    output_folder_name = "output"
  )

  print(p1)
})

# }
# }